

The figures from the Office of National Statistics cover a five-year-period from 2014 to 2019.
From Hart to Burn Valley, here’s how each area has fared in terms of a percentage change.
A Message from the Editor
Support your Mail and become a subscriber today. Enjoy unlimited access to local news, the latest on Pools and new puzzles every day. With a digital subscription, you can see fewer ads, enjoy faster load times, and get access to exclusive newsletters and content. Click here to subscribe.
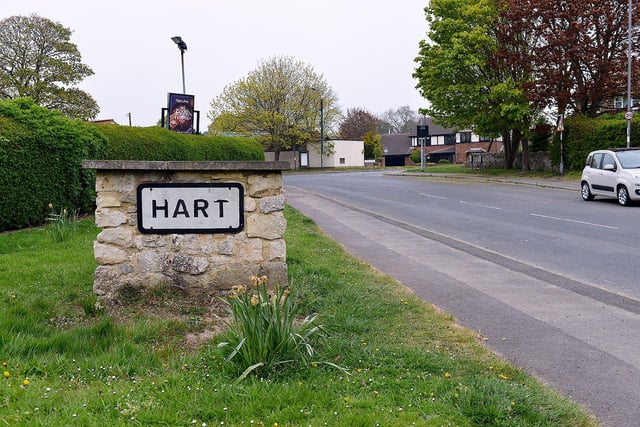
1. No1: Hart
Population in 2019: 9,413 Population in 2014: 8,815 Increase:: 598 Percentage rise: 6.8 Photo: Frank Reid
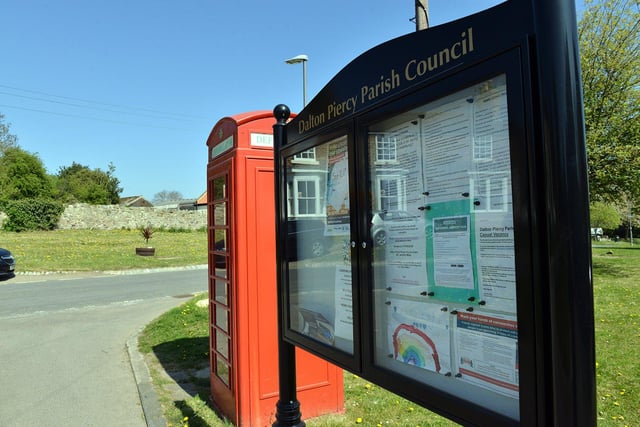
2. No 2: Rural West
Population in 2019: 7,400 Population in 2014: 7,033 Increase: 367 Percentage rise: 5.2 Photo: Frank Reid
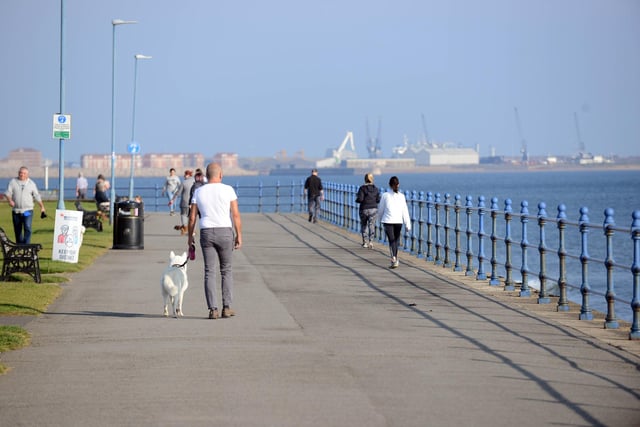
3. No 3: Seaton
Population in 2019: 9,128 Population in 2014: 8,707 Increase: 421 Percentage rise: 4.8 Photo: Stu Norton
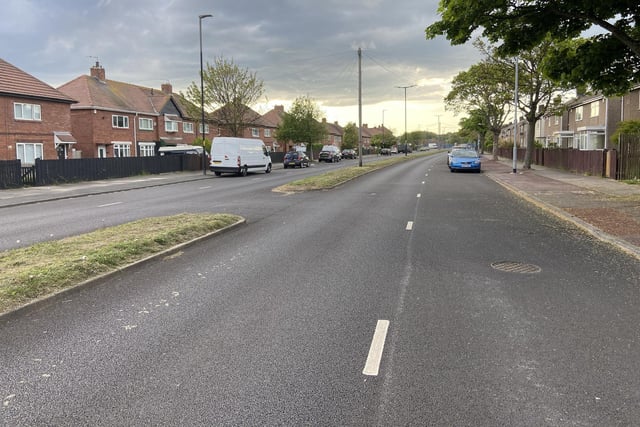
4. No4: De Bruce
Population in 2019: 8,265 Population in 2014: 8,017 Increase: 248 Percentage rise: 3.1 Photo: Frank Reid