


The Teessiders have clearly made progress this term after narrowly avoiding relegation last year, yet the way the season fizzled out was frustrating.
Warnock felt his side should have secured more points as they drifted to a 10th-place finish with 64 points.
So should Boro have finished higher up the table based on their performances?
We’ve taken a closer look at each team’s expected goals totals (for and against) using data from Experimental 6-3-1.
Using the stats taken from individual matches, the site has compiled an alternative league table based on the XG totals to determine results.
There are certainly some interesting findings, which show the teams who have over and underachieved this campaign, based on the chances they have created.
Here are the findings in full.

9. Cardiff (Actual finish 8th)
Expected goals: 60.3 | Goals scored: 66 | Expected goals against: 55.6 | Goals against: 49 Photo: Gareth Copley
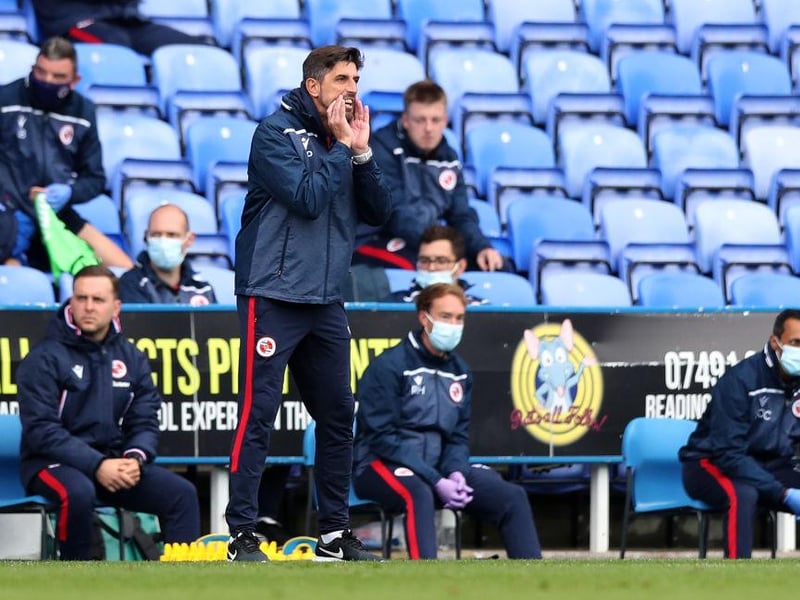
10. Reading (Actual finish 7th)
Expected goals: 57.6 | Goals scored: 62 | Expected goals against: 52.5 | Goals against: 54 Photo: Naomi Baker

11. Nottingham Forest (Actual finish 17th)
Expected goals: 51.7 | Goals scored: 37 | Expected goals against: 57.5 | Goals against: 45 Photo: Laurence Griffiths

12. Luton (Actual finish 12th)
Expected goals: 55.6 | Goals scored: 41 | Expected goals against: 56.1 | Goals against: 52 Photo: Julian Finney